
Szczegółowe informacje dot. FrogTime
You track the time, we handle the rest—zero clicks required.
This is Workforce Intelligence!

Visual
Time Tracking
by Activity
Next-Gen Time Tracking
combines
-
Visual Time Tracking by Activity and
-
Instant Results
Visual Time Tracking by Activity
Recording of
Activities
The recording of working hours by activity has many advantages over the pure recording of attendance.
Activities represent real life in an organization and give you the widest variety of assessments to truly understand the structure of your organization.

Activities
Breaks
Travel Times and Information
Additional Work
Standby Times / Waiting Times
Travel Expenses (Hotel/Breakfast)
Absences
on Projects and Categories
Visual Time Sheet
Even complex workflows with many different activities suddenly become clear with bar chart views.
The stunning logic behind the picture is immediately convincing.
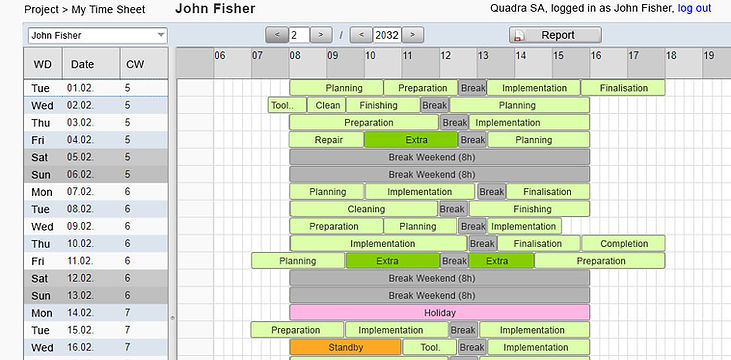
Activities are the Foundation of your Organization
Activities have a major impact on an organization's work outcome.
It's worth keeping an eye on.

Instant Results with Workforce Analytics

Feel the Magic of Workforce Intelligence
The Zero-Click Experience
Results from time data analyses are generated instantly and are always ready.
Zero clicks, no manual triggers,
Your results are simply always available,
in real time.
Just watch the automatic time accounts!
Just see your vacation balance instantly!
Just monitor your projects effortlessly, completely on its own.
Just have converted time data for payroll available in real time.
Just use native reporting for all stakeholders!
Data Processing across all Departments
Gantt bar charts are processed into all departments.
Human Resource Office | Payroll Intergration
Real-time Progress Monitoring of Projects
Health & Safety | Statistics | Qualification
Controlling | Work in Progress | Profitability
Management | Productivity Metrics
Downstream Reporting
Based on our high-quality data entry via Time-Bar-Drawing,
FrogTime offers various reports for each user. This includes e.g.
Customer Reports
Employee Reports
Human Resources Reports
Project Reports
Annual, monthly, weekly Reporting
Downstream Analyses
FrogTime Gantt bars and reports enable teams to gather insights into how they work together.

High-Quality Data
The Quality of Time Data is Crucial
High-quality data is the key to making informed and confident decisions
at all levels.
FrogTime guarantees the data quality.

High Quality Data without Effort
thanks to Visual Data Entry
Wyjątkową cechą naszego systemu rejestracji czasu jest sposób wprowadzania czasu przy użyciu techniki rysowania wykresów Gantta (Time Bar Drawing). Zamiast wprowadzania godzin w formie numerycznej użytkownicy tworzą wykresy Gantta i natychmiast otrzymują przejrzysty obraz swoich aktywności. Nakładanie się czasów i luki czasowe są całkowicie wyeliminowane. Nawet „osoby mające opory związane z prowadzeniem dokumentacji” szybko przekonują się do techniki Time Bar Drawing i dostarczają dokumentację o wysokim poziomie jakości.


Wszystkie dane czasowe niezależnie od sposobu ich wykorzystania wyświetlane są w formie przejrzystych wykresów Gantta. Dotyczy to wszystkich obszarów, np. wprowadzania danych dotyczących użytkowników, przeglądów zarządzania projektem lub przeglądów dla rozliczania personelu. Wszystkie słupki w wykresach Gantta można tworzyć, przesuwać, powiększać, zmniejszać lub kasować. Każdy słupek w wykresie Gantta jest przyporządkowany do personelu, projektu lub pakietu roboczego. Różne kolory słupków reprezentują różne kategorie, takie jak praca, dodatkowy nakład, przerwa, urlop lub chorobowe.
Traceability Convinces
Boost Hiring & Employee Retention!
Employees react positively to the traceability of the agreements made with them.
Transparency builds trust, which attracts applicants and becomes your competitive advantage in recruitment.
